
NO HYPE AI · THE DISPATCH
Six words that make AI draw instead of talk
A comp board, a budget chart, a seller timeline. Copy the word, paste your deal, and look for the red dot.
Six words that make AI draw instead of talk
A comp board, a budget chart, a seller timeline. Copy the word, paste your deal, and look for the red dot.

Paul Cobb
September 29, 2026
Ask a model about a deal and it writes you an essay. Ask it for a picture and it has to commit.
That's the whole trick this week. The last few issues were plumbing. This one is toys. Useful toys.
Credit where it's due: Sabrina Ramonov posted five "visual power words" over the weekend (read hers here). Name a visual, like a timeline or a mind map, plus a topic, and ChatGPT or Claude hands back a picture instead of a paragraph. Hers are for studying. I pointed the idea at real estate.
The word doing the work is the noun. Board, chart, one-pager, timeline. Ask for something you'd lay out on a page and the model has to lay it out, in a plain chat, nothing to set up. In Claude, add "as an artifact" if it doesn't build one. In ChatGPT, add "as a chart."
Why bother? Because prose hides a bad number and a chart doesn't. A wrong comp reads fine in a sentence. On a dot plot it sits off by itself, looking guilty.
Six for a working deal. The first two come with sample images. Every number in them is made up.
1. Comp board
Make me a comp board for these sales. Here's my subject and the comps I pulled [paste or attach]. Table on the left: style, beds/baths, sq ft, year built, adjusted value, match or no match. Dot plot on the right with an ARV band built from matching comps only. Flag any comp whose house type doesn't match the subject and keep it out of the band.
What you get: comps and value read on one screen, mismatches in red. It's the ranch-versus-1.5-story trap from Issue #3, except now you see it instead of catching it on the third reread.

Example data. A sample ranch in Jeffersontown with six made-up comps; two get flagged and left out of the band.
2. Budget burn chart
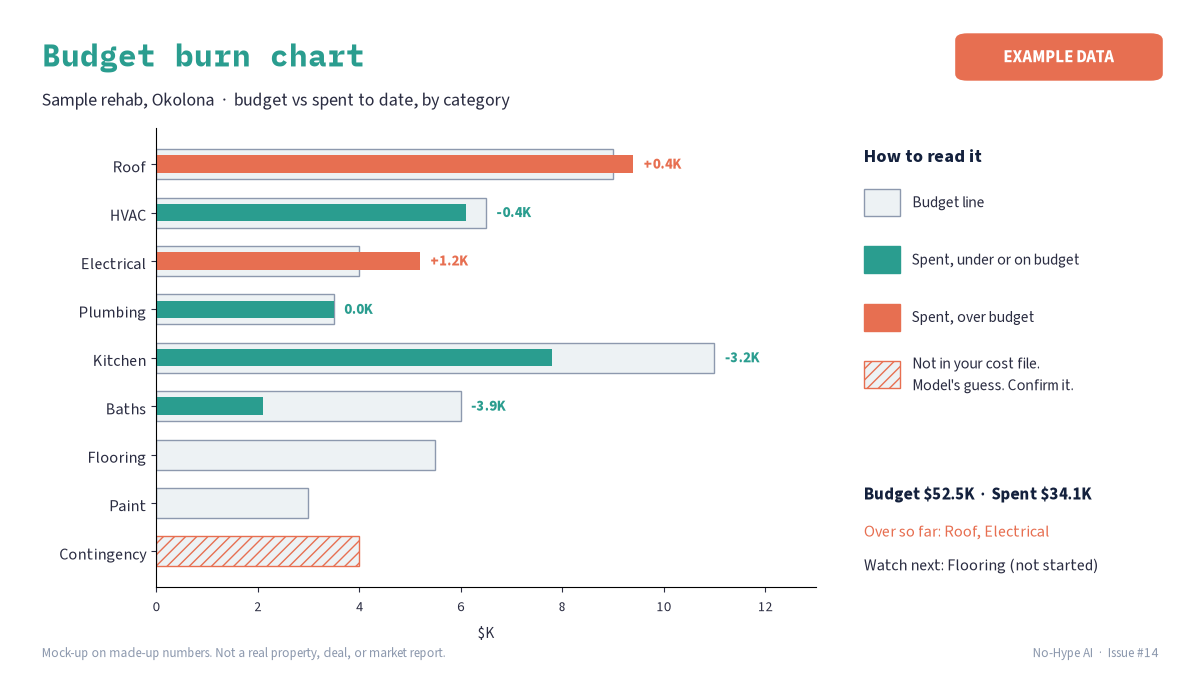
Make me a budget burn chart for this rehab. Here's my budget by category and what I've spent to date [paste]. Horizontal bars: budget as the outline, spent as the fill, green under, red over, variance labeled on each. Use only my numbers. Anything missing from my file, hatch it and label it a guess.
What you get: where the job is bleeding, in three seconds. The hatched bar is the model admitting it guessed. That's the flag-don't-fill rule from Issue #12, drawn.

Example data. A sample Okolona rehab, budget vs spent by category. The hatched bar is a number that wasn't in the cost file.]
3. Deal one-pager
Make me a deal one-pager for this house [attach property data, comps, scope notes]. Six boxes: the house, the value read with a confidence level, condition flags, top five rehab categories, exit fit, and the questions I should ask on the next call. No profit math on the page.
What you get: the page you want in your hand before the seller picks up. My own intake went from about 45 minutes a house to about 16 once everything landed in one view. This is that view, printable.
4. Before-and-after board
Make me a before-and-after board. Here are before photos of three rooms [attach] and my finish picks [list]. One row per room: the before photo, named finish swatches, and a three-line scope checklist. Make it something I can text to my contractor.
What you get: one picture the whole crew builds from. In Issue #6 I handed my cabinet supplier and contractor one finished render so we were all building the same kitchen. This is that move for the whole house. One warning from an operator at a session this summer: his render's shading didn't match the real material, and his installer stopped work because he thought he'd been handed the wrong color. Put the product name on every swatch.
5. Market snapshot
Make me a market snapshot for these Louisville submarkets: [list yours]. One tile each: median sale price, change, days on market, months of supply, and one plain-English line on what it means for a seller. Cite a source and a date for every number, then check each one against its source.
What you get: a monthly read you can post. It's the Issue #5 dashboard shrunk to one image. Drop the checking line and it's decoration.
6. Seller timeline
Make me a seller timeline: one page for a homeowner selling to a cash buyer, from first call to closing. Two rows: what they do, what we do. Plain words, no jargon, no dollar figures, and say plainly that every sale is different.
What you get: what a nervous seller wants most, which is knowing what happens next. Closest cousin to Sabrina's timeline. Keep offer numbers off it. Those belong on a call, not in a graphic.
The bonus line: show me your guesses
Add it to the end of any of the six.
Show me your guesses. Mark every number you estimated instead of taking from my data. Hatch it, color it, or footnote it. If nothing was estimated, say so.
This is the one that makes the other six safe. A chart makes a guess look official. The same guess is more convincing in a clean bar chart than in a sentence, which is backwards from what you want.
Where it breaks.
Pretty is persuasive. A chart doesn't make a number true, it makes it believable. Feed it your numbers, not the internet's, and check the totals, because a model can draw a beautiful chart on top of bad addition. I keep a deterministic engine under my rehab estimates for that reason. The model never touches the math. It draws what the math already says. And anything you post stays at the neighborhood level. No addresses on the pretty version either.
The play. Pick one deal on your desk this week. Ask for a comp board on the comps you already pulled, end with "show me your guesses," and look for the red dot. If there isn't one, good. Now you know.
Know an operator who still reads comps down a spreadsheet column? Forward this. And hit reply with the visual you'd add to this list. I read every one.
Credit: the visual power words idea is Sabrina Ramonov's.
Written by Paul Cobb, real estate operator (Louisville / Kentuckiana), forVEX builder. I run the plays I write about. More depth: forvex.app/journal